Phase Fractions at Constant X or T
In the following example, we demonstrate the simultaneous calculation of line phase equilibria for multiple Gibbs energy parameter sets in CALPHAD using PDUQ, followed by a visualization.
Set-up
In this example we will reuse the eq file from the previous example where we performed UQ tasks on the full Cu-Mg phase diagram.
First, we import the plot_phasefracline function from the uq_plot module.
from pduq.uq_plot import plot_phasefracline
Data Analysis and Plotting
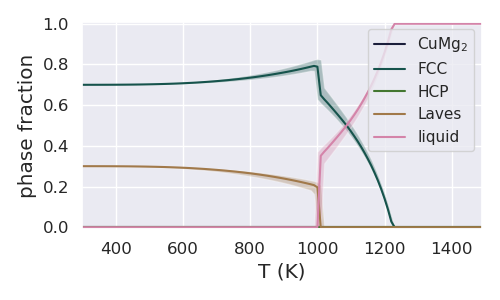
Let us start by plotting the phase fraction as it varies with temperature with the composition fixed at 0.1 molar fraction Mg.
# define a dictionary fixing the composition. We need to pick
# a value for X_MG that is represented in the eq object
coordD = {'X_MG':0.1}

# plot the phase fraction versus composition
# cdict and phase_label_dict are the same as in the previous example
uq.plot_phasefracline(eq, coordD, xlabel='T (K)', cdict=cdict,
                      phase_label_dict=phase_label_dict, figsize=(5, 3))
resulting in the following figure
Next we plot the phase fraction as it varies with composition at 1000K.
# define a dictionary fixing the temperature. We need to pick
# a value for T that is represented in the eq object
coordD = {'T':1000}

# plot the phase fraction versus composition
# cdict and phase_label_dict are the same as in the previous example
uq.plot_phasefracline(eq, coordD, xlabel=r"$x_{Mg}$", cdict=cdict,
                      phase_label_dict=phase_label_dict, figsize=(5, 3))
resulting in the following figure
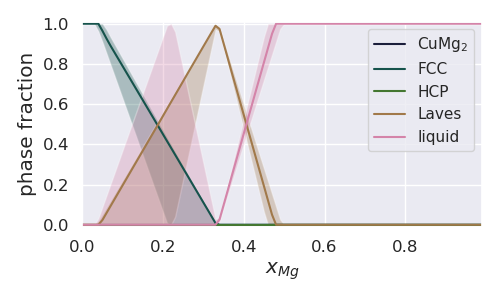
On first glance, this figure looks fairly odd - for example there are large uncertainties in the liquid phase fraction at 0.2 molar fraction Mg. The reason for this interesting behavior becomes more clear when looking at the entire Cu-Mg phase diagram with uncertainty in the previous example. From the phase diagram it is clear that the invariant is close to 1000K and X_Mg = 0.2, leading to uncertainty in the phase fraction of the liquid, FCC and Laves phases.
Looking even more closely, it is odd that the mean phase fraction for the liquid phase is zero when the uncertainty is so broad. This is because for almost all parameter sets at 1000K and X_Mg ~ 0.2, the invariant is at a higher temperature leading to a 0 phase fraction of liquid. For parameter sets with a lower invariant, however, the liquid phase fraction at around 0.2 molar fraction Mg is 1.